
Features

Budgeting
Build accurate project quotes in minutes
Profitability
Take the guesswork out of project success
Controlling
Effortlessly achieve precise data quality
Reporting
Deep insights into your project business
OS/ AI
Der AI Agent für Agency Intelligence. Eingebaut in OS/.
Project billing & e-invoicing
Working hours and project time at a glance
Time tracking
Working hours and project time at a glance
Contacts
Keeping your customer and supplier data up to date at all times
Customer satisfaction
Give project stakeholders a voice
my OS/
Companion iOS and Android app for insights on the go
Solutions
Expected
Projects that meet all your expectations
True Labor Costs
Know your true labor costs down to the cent
Overhead Cost Factor (OCF)
Complete control over your overhead
Benchmarks
Gain clear insights into your competitive situation
Multi-company setup
Multiple companies, one team? Easy with OS/
Onboarding & User Support
No time for onboarding, training, and support? No problem with OS/
For
Workflows
Greater insight, greater success: with the new Controlling service in OS/!
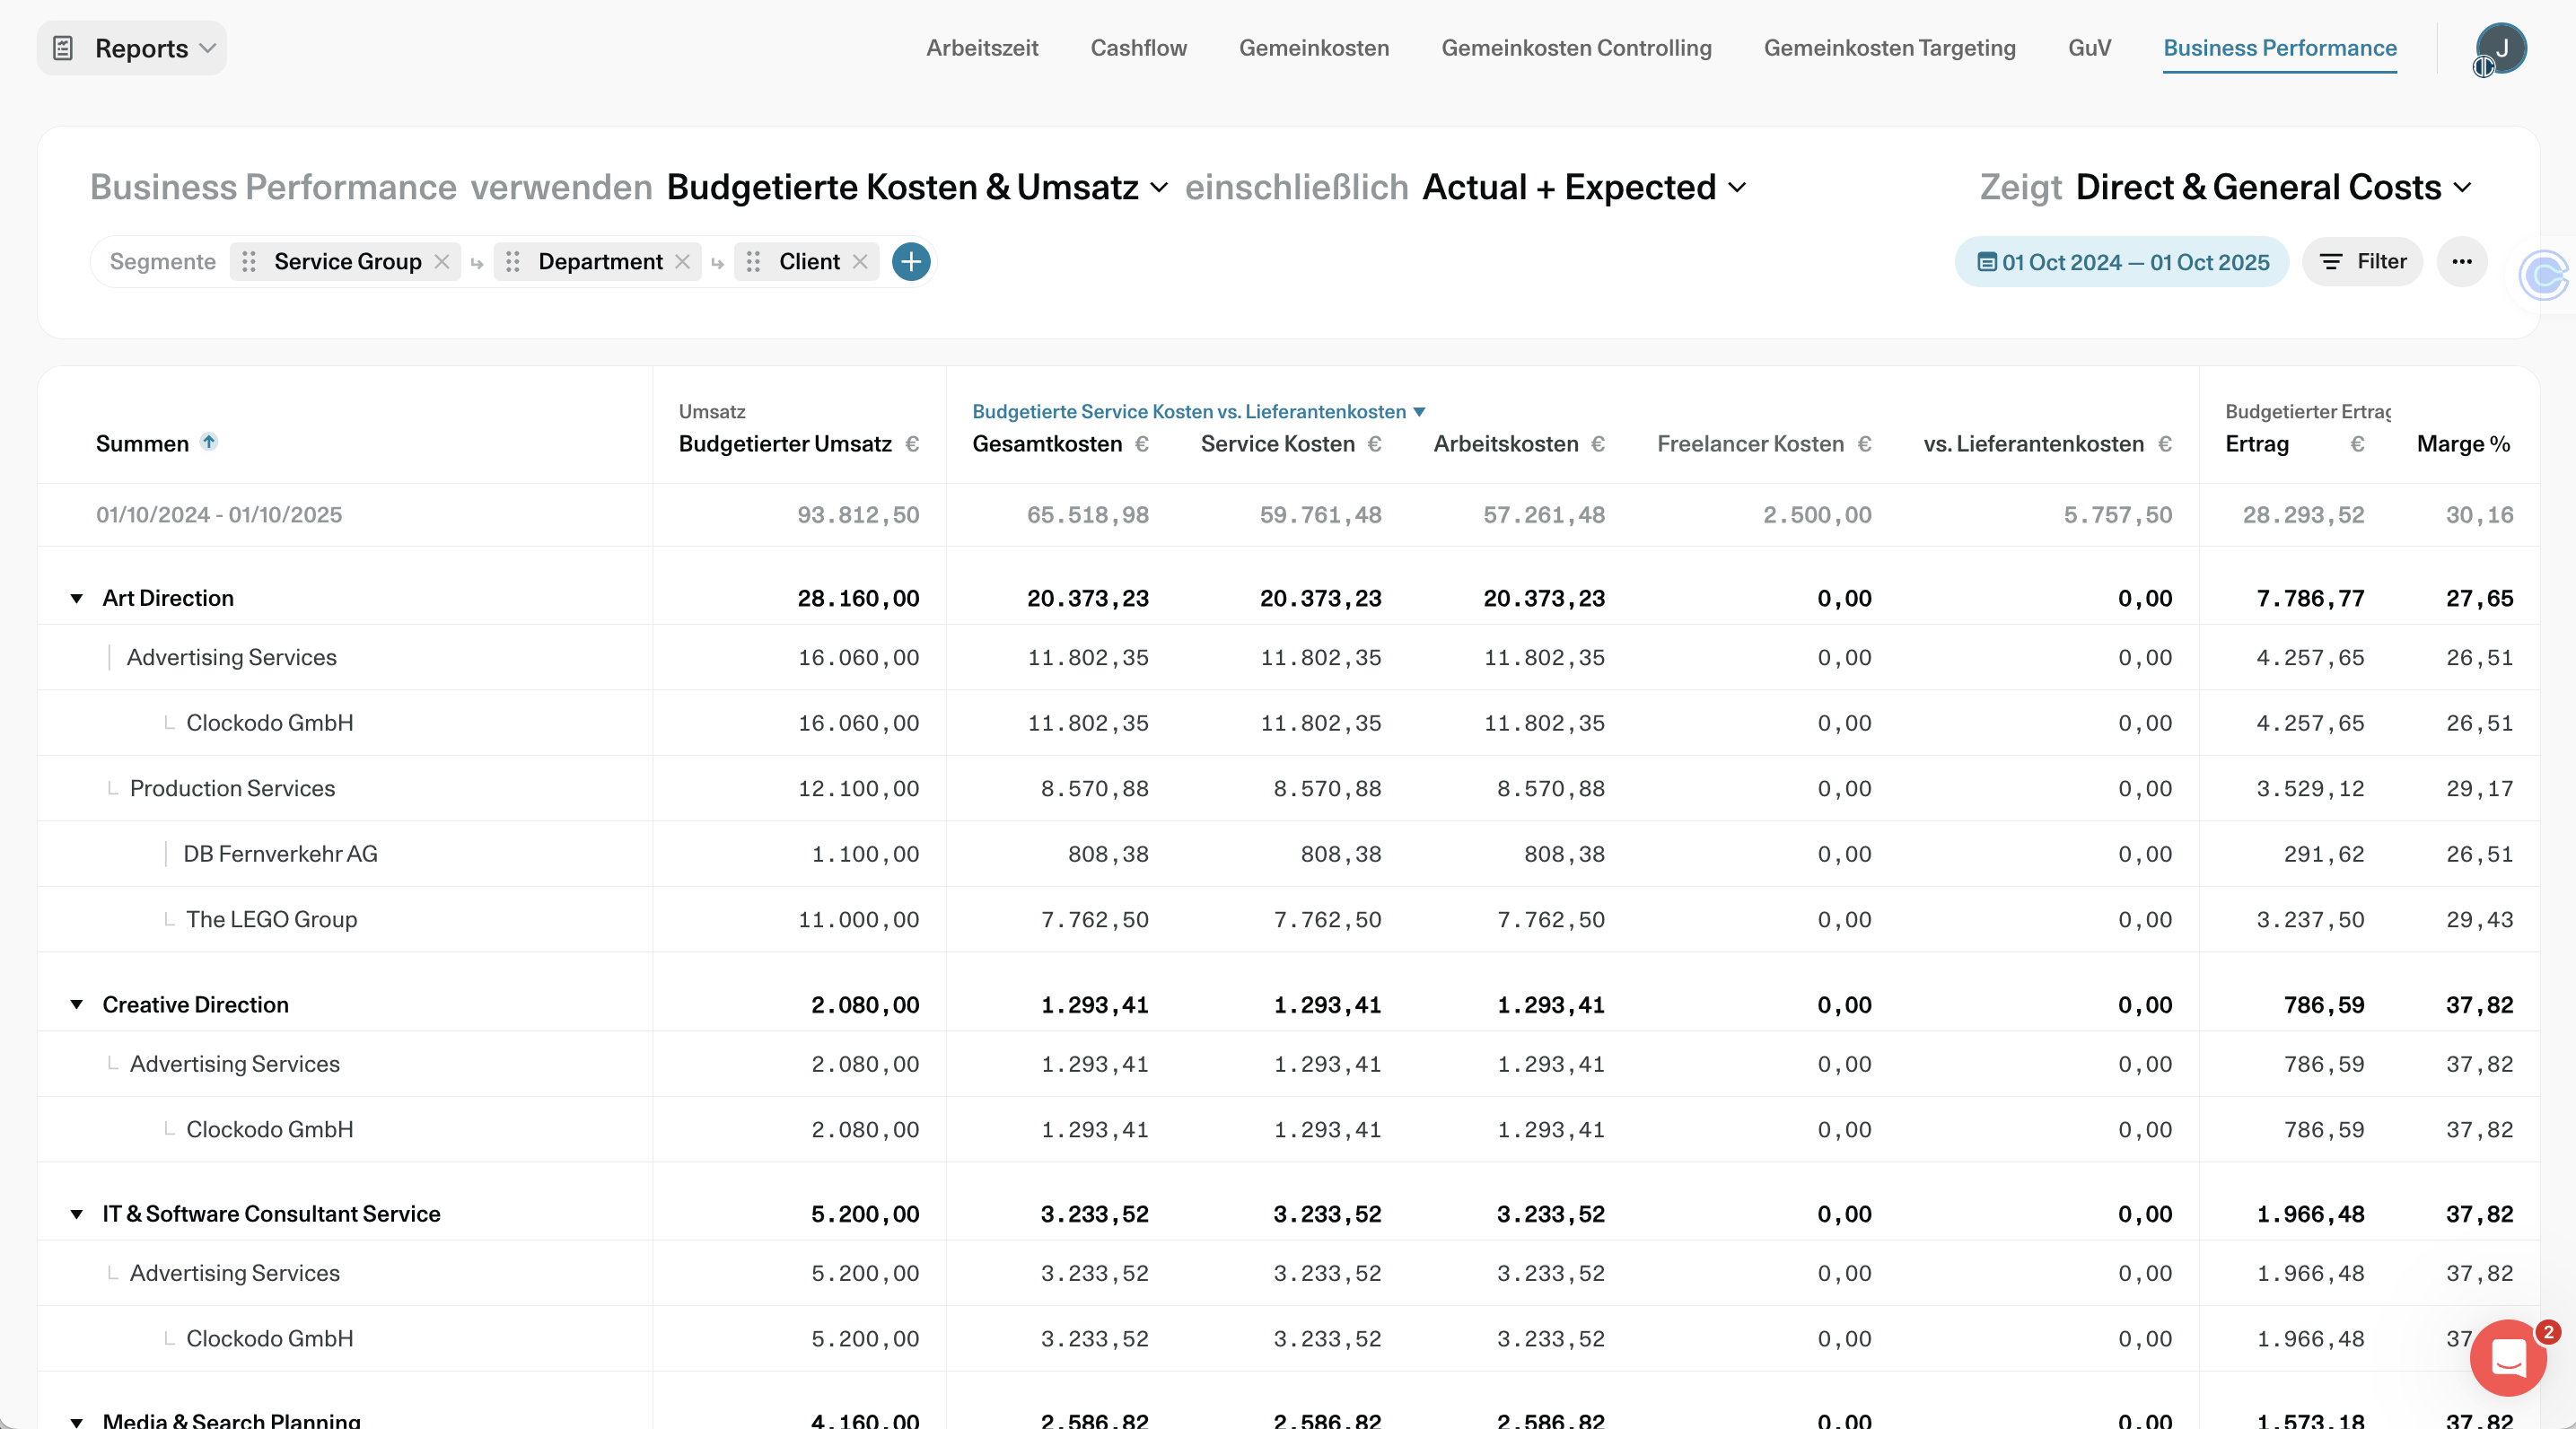
Big Announcement! 🚀
Starting immediately, you will find a detailed Service Performance Report in OS/ for better agency control and clarity.
Where can you find the new Service Report?
In the Business Performance Report, of course!
Simply add the “Services” segment and see at a glance how profitable your individual services really are.
Whether it's art direction, consulting, or project management, you can now immediately see which services are driving your agency's revenue and where there is still room for improvement.
.gif)
Put together the overview you need and experience a business performance report unlike anything you've seen before.
What exactly does the Service Report show?
The Service Performance Report gives you deep insight into your pricing and cost structures.
It shows you how much margin you actually achieve with your services. You get answers to questions such as:
- “What external costs were incurred for color grading in the last quarter so that I can present our customer with appropriate prices in accordance with our retainer agreements?”
- "What is the gross margin of my service catalog, and does my current price list match it?”
- “How much did I spend on art direction in my projects for our client Rovella? The expense seems so high this month.”
For full transparency about your services and their profitability.
That's not all!
Starting now, you can also see the distribution of personnel costs for each employee in the Raincloud diagram in your services.
.gif)
This gives you complete transparency regarding how personnel costs are distributed across your services, enabling you to make informed decisions about your pricing structures.
6 Wochen
Unverbindlich testen
Teste OS/ kostenlos und unverbindlich mit deinem gesamten Team, mit vollem Funktionsumfang und kostenlosem Support...